How to use eclipse cdt as front end of arm gdb
Created:
Updated:
reference
Using elipse cdt(C/C++ development Tooling) as the front end of arm gdb
gdb has a lot of features, but it is a command line interface, so it takes time to become proficient. Using TUI mode is a little more convenient, but it is still inconvenient than GUI interface. Here I will explain how to use eclipse cdt as the front end of arm gdb.
Install eclipse cdt
- Downloads “eclipse C/C++ IDE” and decompress/install it.
- https://www.eclipse.org/cdt/downloads.php - Launch “eclipse C/C++ IDE”
- In menu, help -> Install New Software… -> click Add… and input like below.
- ex) if you are installing cdt 10.7- Name: cdt10.7
- Location: https://download.eclipse.org/tools/cdt/releases/10.7
- click Select All and click Next> -> … -> Finish
Debugging helloworld with cdt
After installing as above, run qemu and start debugging after setting eclipse debug configuration. Here, I will explain how to debug by running helloworld program with qemu and cdtdebug. Write helloworld.c file as below and compile it with gcc arm compiler.
- helloworld.c
1
2
3
4
5
6
#include <stdio.h>
int main(void)
{
  printf("HelloWorld!\n");
  return 0;
}
- Compile with gcc arm toolchaing
1
$ arm-none-linux-gnueabihf-gcc -o helloworld helloworld.c -g -static
- Run qemu
1
$ qemu-arm -g 1234 helloworld
- eclipse debug configuration
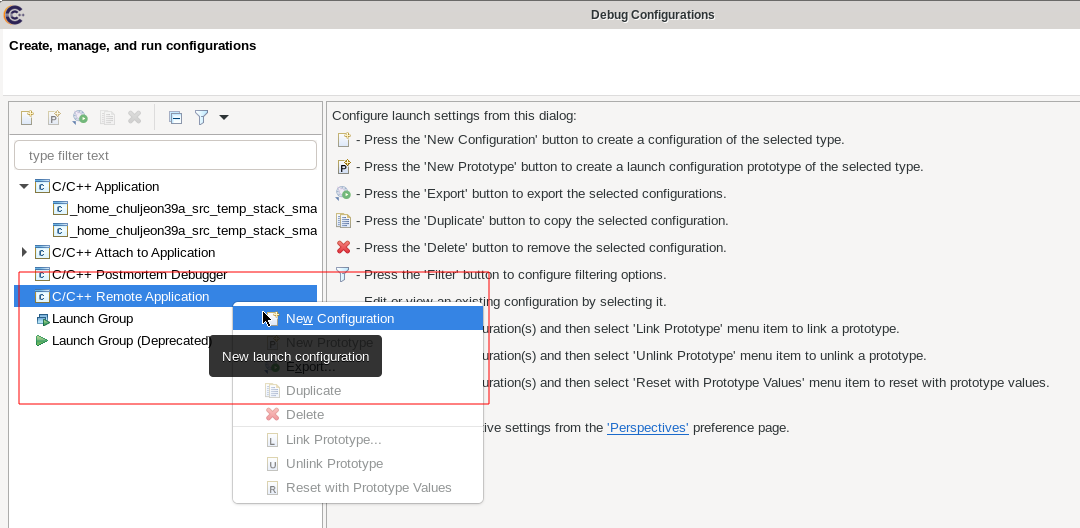
- In eclipse menu, click Run -> Debug Configurations
- Choose C/C++ Remote Application, click the right mouse button, choose New Configuration menu
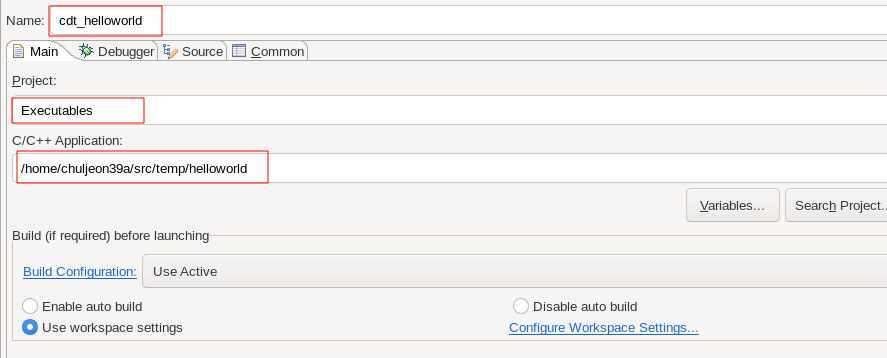
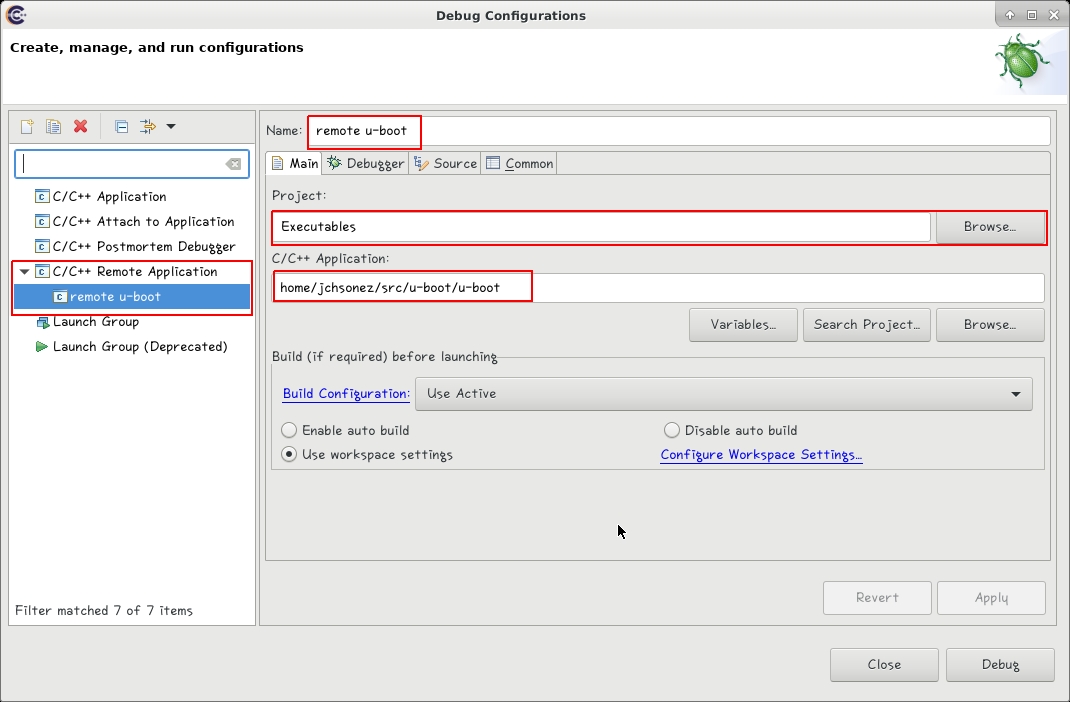
- Input name at Name: field
- In Project: field, click Browse… button, and then choose Executables
- In C/C++ Application:, specify the elf file to use for debugging
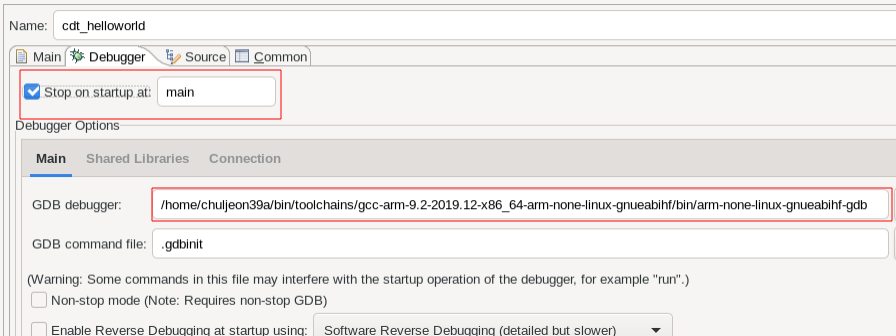
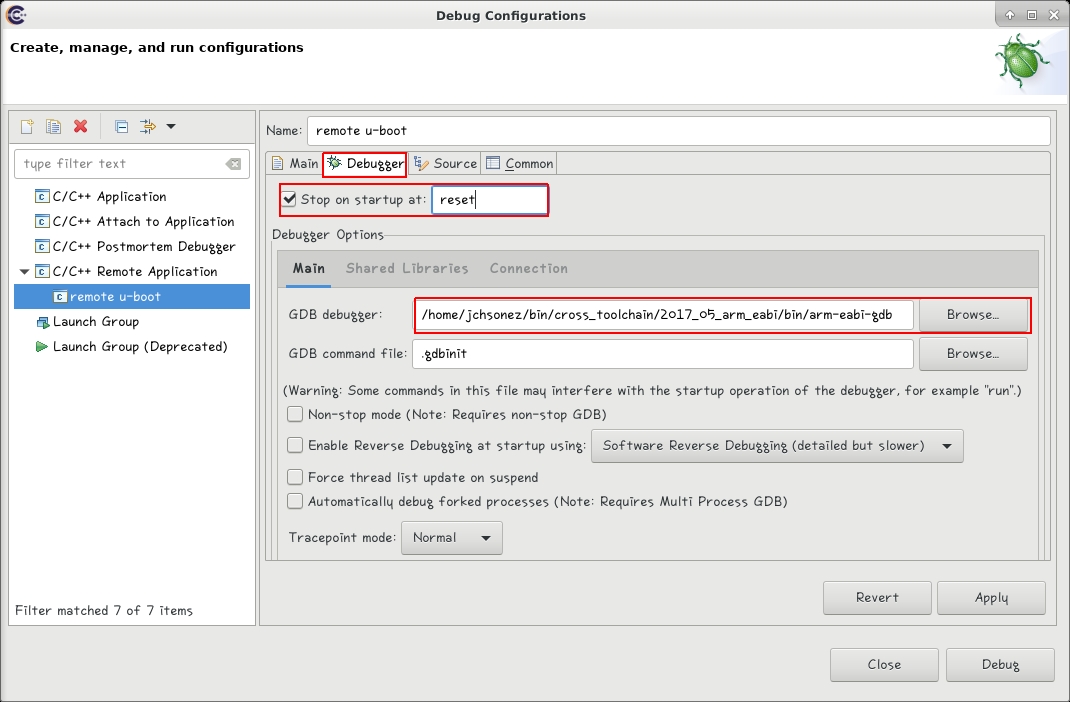
- Choose Debugger tab
- Select the checkbox before Stop on startup at:, then input main or desired breakpoint in the field
- In GDB debugger:, Input the absolute path of arm-eabi-gdb
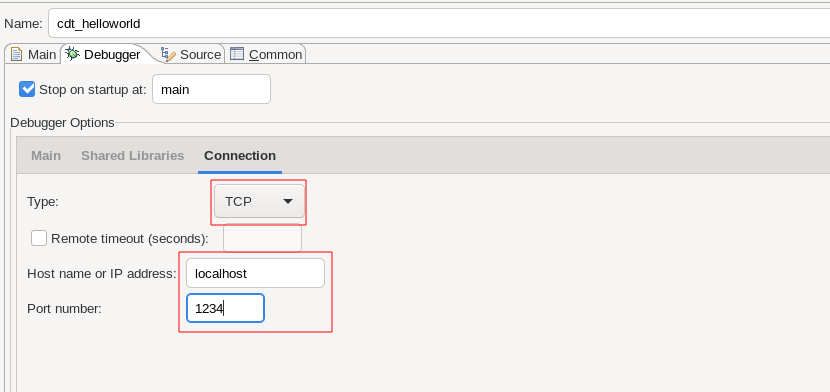
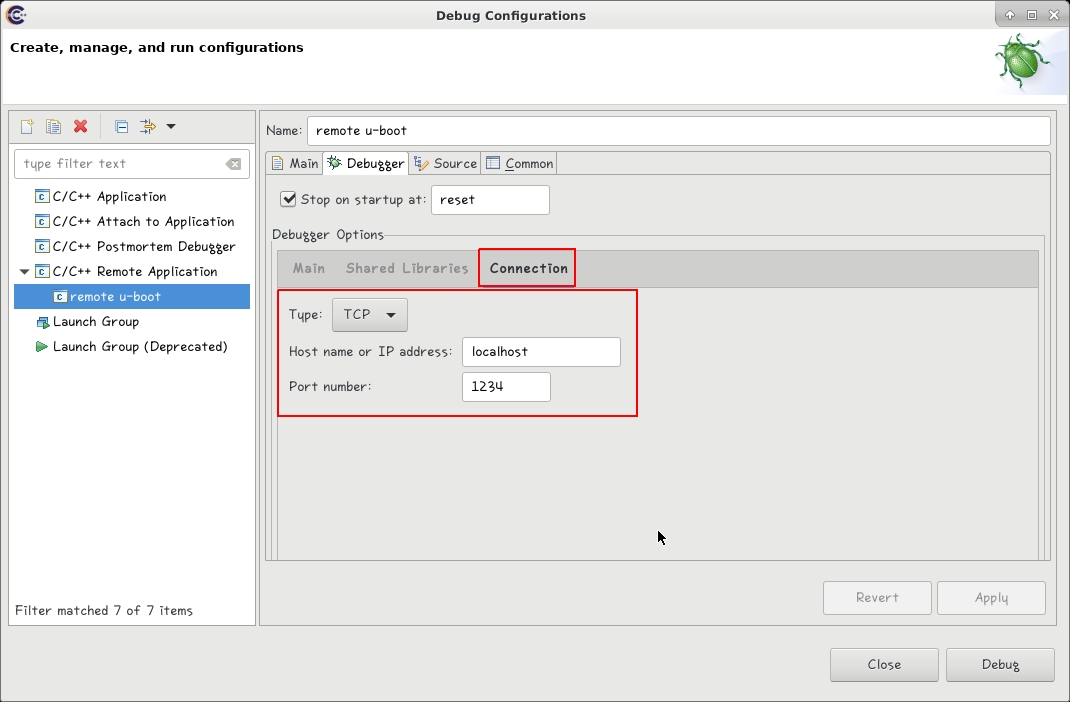
- In Debugger tab, choose Connection tab
- Input Type : TCP, Host name or IP address : localhost, Port number : 1234
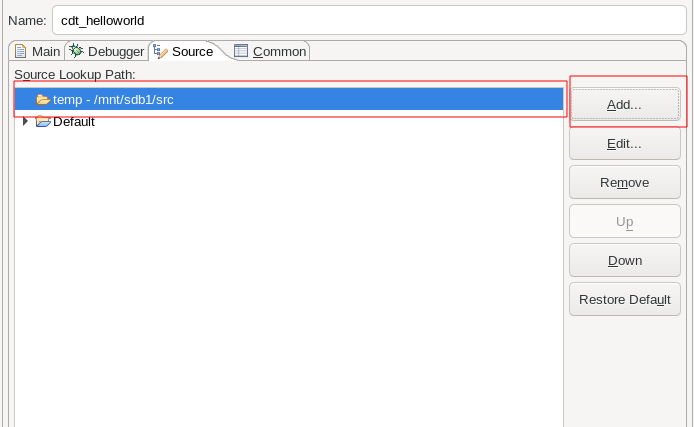
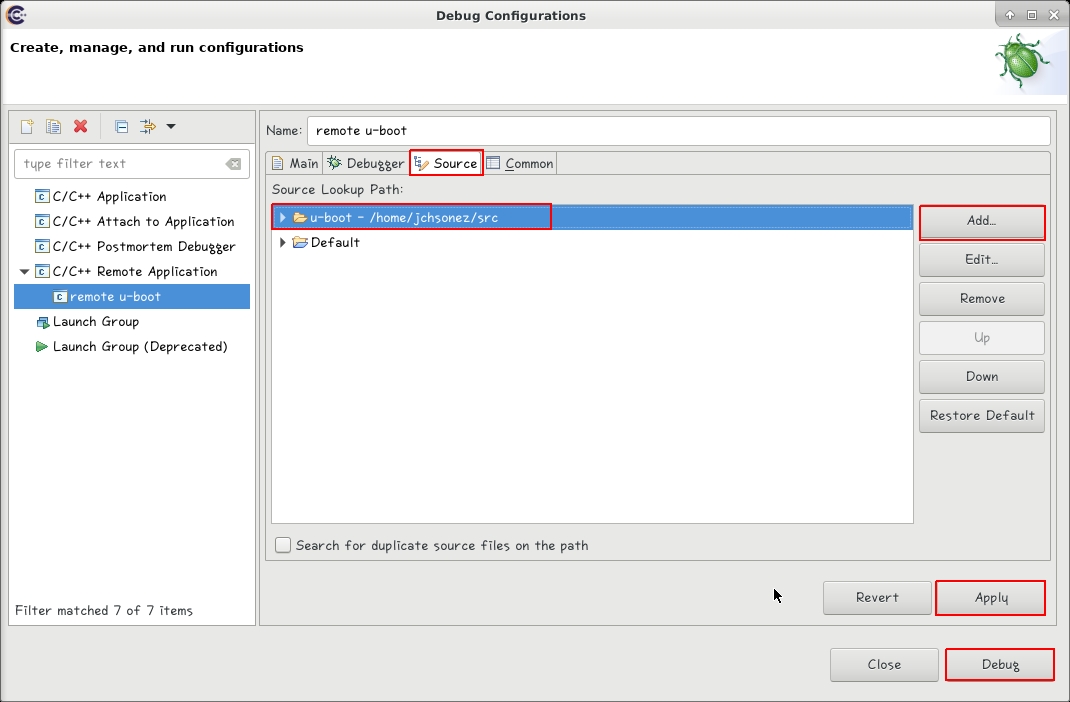
- Choose Source tab
- Click Add… button, choose File System Directory, set the source file path
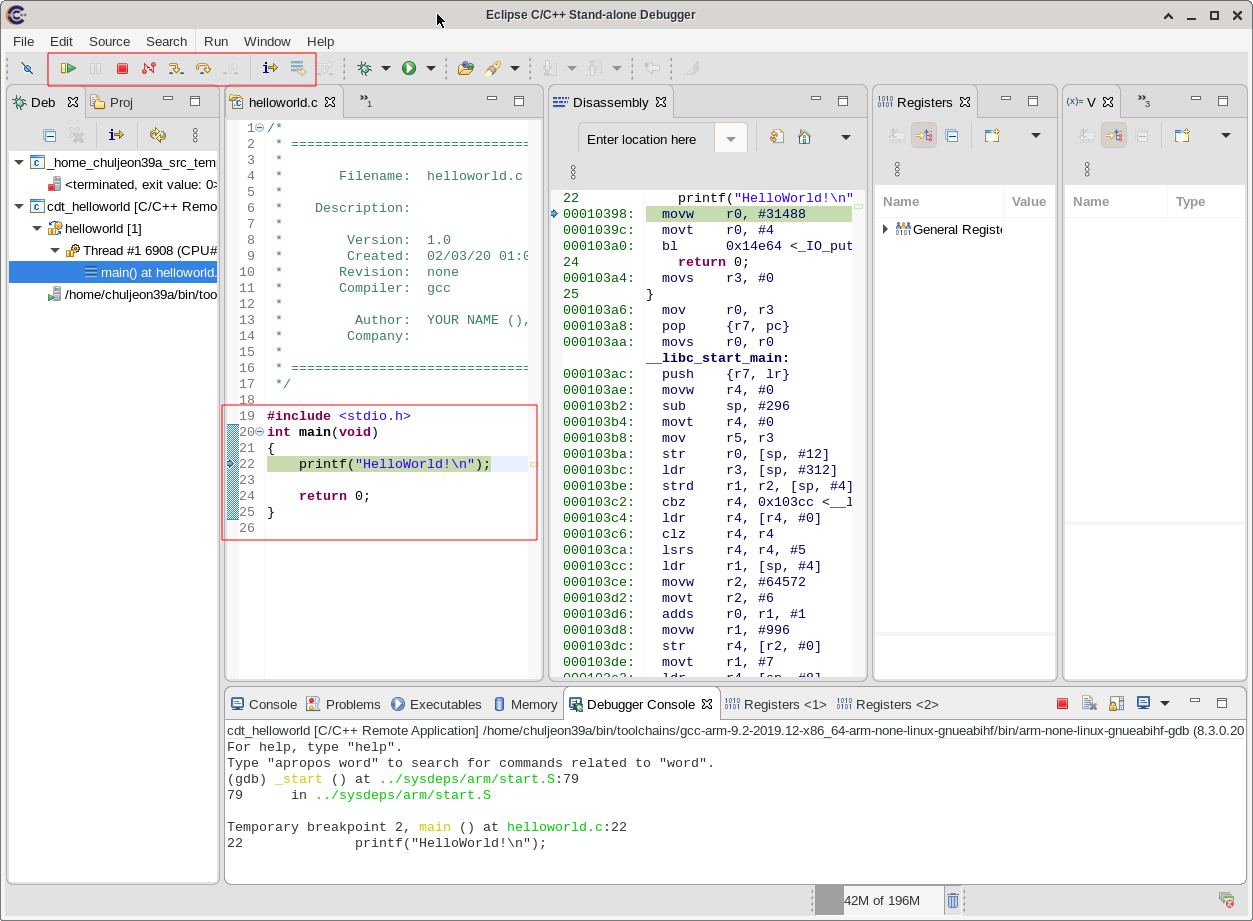
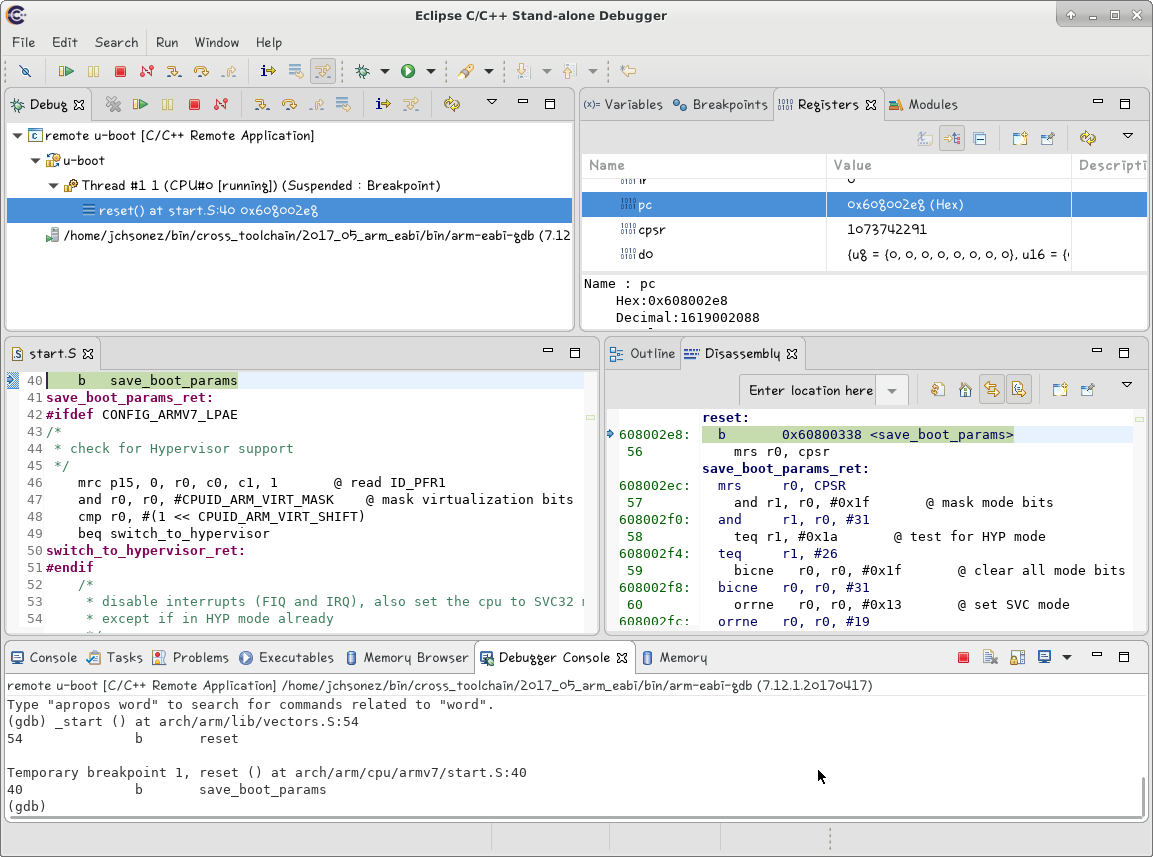
- Click Apply button, click Debug button, then the screen which stopped at the breakpoint(ex.main) appears.
- In this state, debug by clicking “Step Into” and “Step Over” buttons.
- “HelloWorld!” is printed in terminal window
1
2
3
$ qemu-arm -g 1234 helloworld
HelloWorld!
$
Debugging uboot with cdt
1
$ qemu-system-arm --machine vexpress-a9 -m 1G -nographic -kernel u-boot -s -S
Leave a comment